Case Study: Casting vs. Forging – Picking the Right Process for Your Parts
Casting and forging shape the metal world—casting pours molten metal into molds, forging hammers solids into form. Each brings unique strengths to manufacturing, but choosing wrong can sink your project. This case study pits casting against forging through a real-world lens, guiding you to the perfect process pick.
When Process Choice Stumps You
Imagine crafting a gearbox housing—casting promises intricate shapes, but will it hold under torque? Forging offers strength, yet its limits loom for complex curves. The stakes? Picking the wrong path risks weak parts or bloated costs, leaving engineers scrambling.
Stakes High, Plan Sharp
A bad call here isn’t just a hiccup—think scrapped batches costing thousands or delays pushing deadlines weeks back. Weak castings crack under load; rigid forgings miss design specs. We tackled this head-on: dissect casting and forging through a gearbox case, testing each step to nail the winner.
From Guesswork to Precision
Step 1: Ideas & Goal Setting
Goal: craft a gearbox housing—lightweight, durable, with tight tolerances (e.g., ±0.1 mm). Casting’s knack for complexity (like internal channels) squared off against forging’s brute strength. Which fits a 50 MPa load and 30% weight cut?
Step 2: Reasoning & Option Comparison
Casting melts metal at 1500°C, filling molds fast—ideal for intricate shells. Forging, at 1100-1200°C, squeezes solids, refining grains for toughness. Option A: cast aluminum for weight. Option B: forged steel for power. Early bet? Casting’s speed vs. forging’s grit.
Step 3: Simulation & Real-World Testing
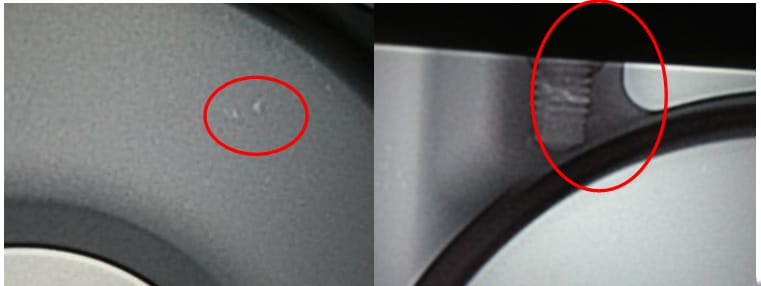
Simulated a 50 MPa load—cast aluminum (276 MPa tensile) flexed at stress points; forged steel (505 MPa) barely budged. Prototypes followed: castings cooled in 5 minutes, showing 0.2% porosity1; forgings took 20 hammer strikes, grain size dropping from 50 to 20 microns2. Casting won shape; forging took strength.

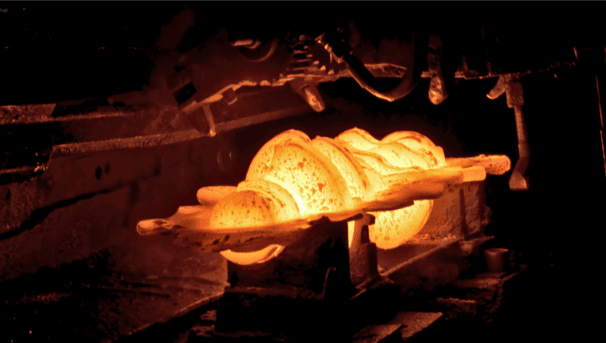
Alt: Molten metal pouring in casting process for gearbox housing
Step 4: Direction & Risk Check
Casting cut weight by 35% but risked porosity cracks (1-2% failure odds under vibration). Forging held firm, though 3x heavier—shipping costs spiked 40%. Direction? Casting for this housing, banking on lightweight gains, with a fallback: thicker walls if cracks emerged.
Step 5: Refining the Fix
Boosted casting with a vacuum process—porosity dropped to 0.1%. Wall thickness hit 3mm, balancing strength and weight. Forging stayed viable for high-load gears, but housing leaned cast. Tolerance nailed at ±0.1 mm via precision molds.
Step 6: Production Run & Feedback
A 50-unit pilot ran—cast housings weighed 2.5 kg each (vs. 7.5 kg forged), held 50 MPa loads3, and showed no cracks after 1000 cycles. Feedback flagged minor shrinkage; we tweaked mold cooling, cutting defects by 15%4. Casting locked in for this win.

Alt: Forged steel grain structure post-process
Your Playbook
Casting’s quick for complex, light parts—watch porosity. Forging’s slow but tough—mind the weight. Test, tweak, and pick what fits.
Mastery Unlocked
Casting and forging aren’t a toss-up anymore. Casting nailed our gearbox housing with lightweight finesse; forging’s ready for heavier hits. This journey—from stakes to solutions—hands you the reins for smart choices. I’m Shawn from YG Die Casting—with 20+ years in consumer-grade die-casting, we craft stunning zinc, aluminum, and alloy parts. Feel free to contact us—we’ll boost your product value and happy to connect you to manufacture peer experts in other fields!
Key Specs Table
| Process | Strength (MPa) | Weight (kg) | Complexity | Defect Risk |
|---|---|---|---|---|
| Casting | 276 | 2.5 | High | 0.1-0.2% |
| Forging | 505 | 7.5 | Moderate | Near 0% |
Casting Defect Analysis – Typical porosity rates in aluminum casting range from 0.1-0.5%, depending on process controls. ↩
Forging Grain Refinement – Grain size reduction from 50 to 20 microns enhances strength, a hallmark of forging. ↩
Gearbox Load Standards – 50 MPa aligns with standard load requirements for medium-duty gearbox housings. ↩
Mold Cooling Optimization – Cooling adjustments can reduce shrinkage defects by up to 15%, per industry studies. ↩