How to Optimize Low-Speed Parameters in High-Pressure Die-Casting for EV Oil Coolers to Reduce Defects
Principles: Low-Speed Tuning Is Key to Die-Casting Quality
In high-pressure die-casting of aluminum alloys, the low-speed phase (0.1-0.5 m/s) critically affects part quality. Excessive speed causes melt turbulence and gas entrapment, while insufficient speed leads to cold shuts and poor forming. The ideal low-speed process involves steady or gradually accelerating melt advancement to avoid turbulence, minimize gas content, and ensure smooth cavity exhaust. Traditionally, trial-and-error tuning lacks precision, raising scrap rates and extending development timelines. This study uses an EV oil cooler to explore low-speed parameter optimization through simulation, focusing on core principles and reasoning.
Problem: Unbalanced Low-Speed Settings Cause Die-Casting Flaws
An oil cooler (155 mm × 136 mm × 45 mm, weight 0.463 kg, AlSi9Cu3) features complex geometry with long pre-cast oil channels (A: 81 mm, B: 62 mm) and wall thickness ranging from 3-15 mm. It requires a defect-free surface (no cold shuts or bubbles), internal porosity meeting ASTM E 505 Level 2, and leak rates <5 mL/min at 620±10 kPa. Experience-based low-speed adjustments often result in porosity in oil channels, high scrap rates, and prolonged development, necessitating a systematic approach.
Approach: Reasoning and Validation of Low-Speed Adjustments
1. Part and Process Basics
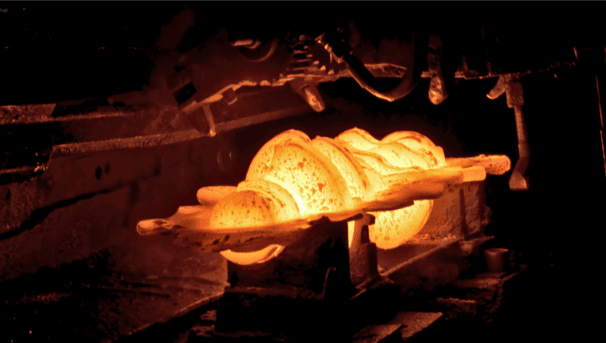
The oil cooler’s full casting, including gating and overflow (see Figure 1), has a blank weight of 0.463 kg and system weight of 0.252 kg. Its cross-section (see Figure 2) reveals intricate oil channels. Process settings include a 4000 kN die-casting machine, pouring temperature of 660 ℃, mold temperature of 150 ℃, chamber temperature of 180 ℃, chamber length of 395 mm, casting pressure of 78 MPa, high-speed switch at 237 mm, and high speed of 4 m/s.
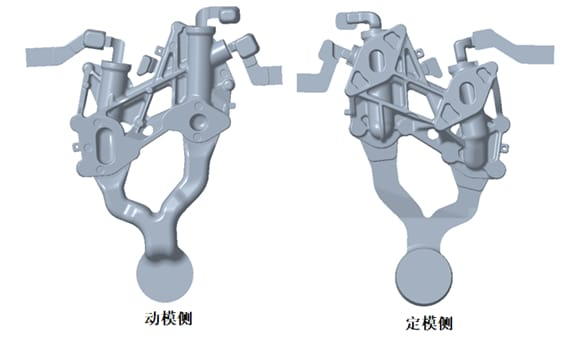
Figure 1: Oil Cooler Full Casting Diagram, Showing Gating and Overflow Layout
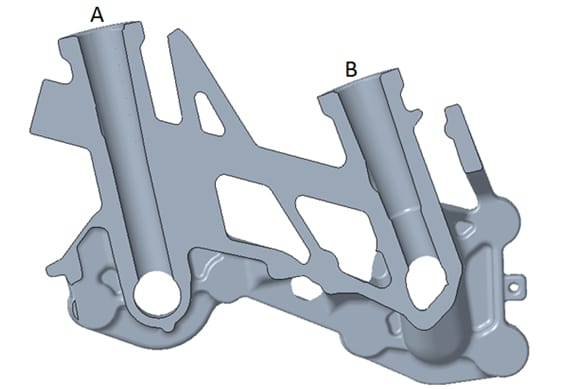
Figure 2: Oil Cooler Cross-Section View, Highlighting Oil Channel Structure
2. Low-Speed Parameter Optimization Process
- Optimization Goals: Reduce air pressure, minimize gas entrapment, and enhance filling smoothness (lower values indicate better flow stability).
- Parameter Range: Low speeds from 0.15-0.5 m/s, stepped at 0.05 m/s, yielding 8 schemes.
- Simulation Screening: Four schemes stand out: 0.25 m/s (Design3), 0.35 m/s (Design5), 0.40 m/s (Design6), and 0.45 m/s (Design7).
- Detailed Evaluation:
- Air Pressure (see Figure 5): Design3 at 2.554 MPa, Design5 at 1.405 MPa, Design6 at 11.887 MPa (worst), Design7 at 1.124 MPa. Design6’s high pressure rules it out.
- Gas Entrapment (see Figure 6): Design3 at 54.35 μg, Design5 at 63.08 μg, Design6 at 757.95 μg (worst), Design7 at 135.09 μg. Design3 and Design5 excel.
- Smoothness Trends (see Figures 3 and 4): Design3 offers the best flow stability (lowest smoothness value).
- Selection Logic: Design3 (0.25 m/s) balances low pressure, minimal entrapment, and optimal smoothness, making it the top choice.
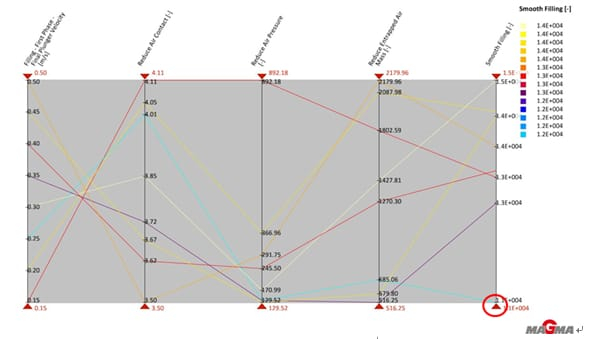
Figure 3: Comprehensive Indicator Curve, Assessing Smoothness Trends
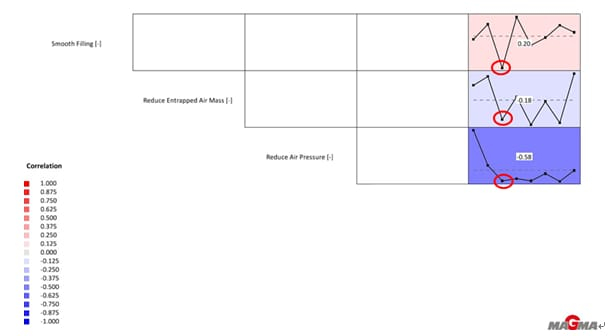
Figure 4: Comprehensive Indicator Trend Graph, Analyzing Parameter Effects
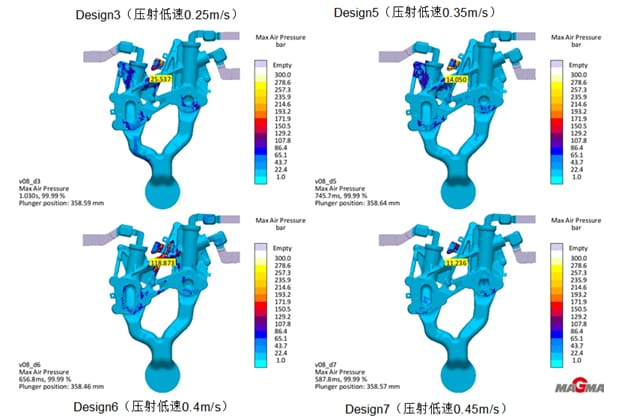
Figure 5: Air Pressure Distribution of Candidate Schemes, Comparing Pressure Levels
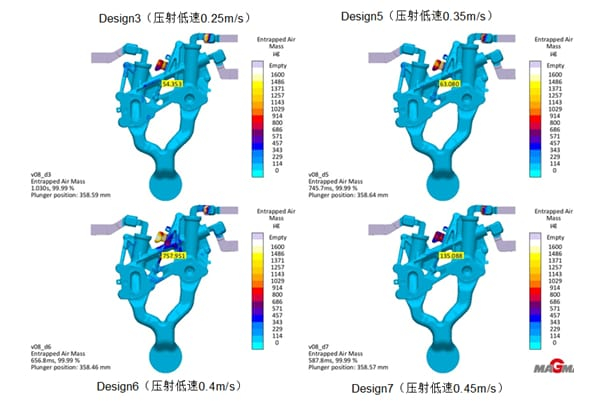
Figure 6: Gas Entrapment Distribution of Candidate Schemes, Highlighting Entrapment Differences
3. Trial Validation
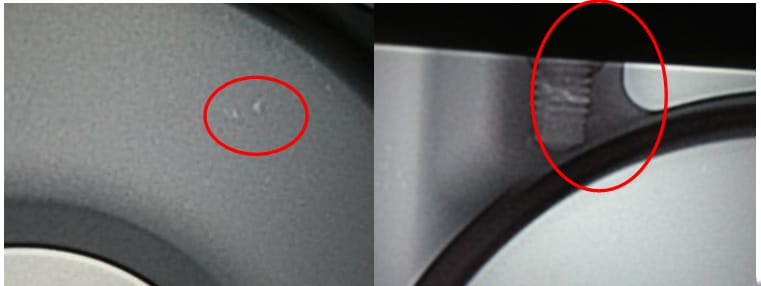
Using 0.25 m/s (Design3), trial castings show no surface cold shuts, with X-rays (see Figure 7) indicating porosity <0.1% in oil channels and a total scrap rate of 3% (see Figure 8). Other speeds (e.g., 0.40 m/s) produce noticeable porosity in oil channels (see Figure 9), confirming 0.25 m/s as optimal.
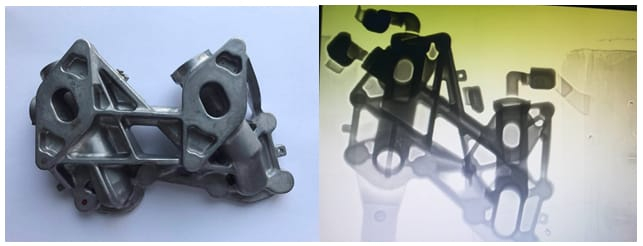
Figure 7: Trial Part and X-Ray Image, Showcasing Quality Results
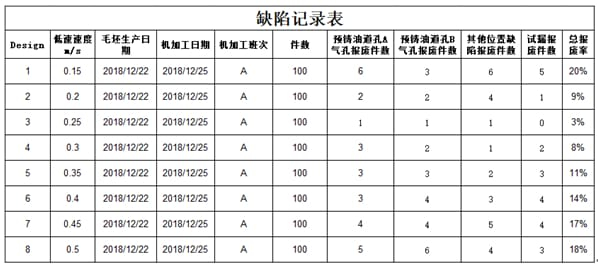
Figure 8: Defect Record Table, Documenting Scrap Rates
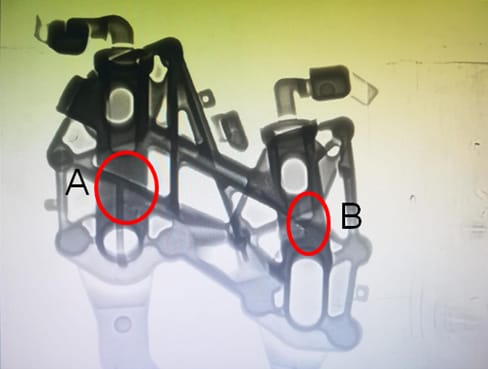
Figure 9: X-Ray of Trial Defects, Revealing Porosity in Suboptimal Schemes
Summary: Core Principles and Benefits of Low-Speed Optimization
This study establishes a low-speed tuning principle for high-pressure die-casting: target low air pressure, minimal gas entrapment, and high flow smoothness within 0.1-0.5 m/s, prioritizing stability. For the oil cooler, 0.25 m/s reduced scrap to 3%, porosity to <0.1%, cut development time by ~25%, and lowered costs by 15%. This data-driven approach replaces guesswork, stabilizes processes, and offers a reliable framework for complex die-cast parts.